
Our read
Qualitative judgments on a five-point scale, not licensed index values. Ranked #27 of 49 markets we cover.
The case for
- Port volume growth drives logistics employment, and the market is small enough that pricing has not fully caught up.
The case against
- Limited institutional depth and a narrow band of qualified operating partners.
Our stanceScreening opportunistically alongside a local operator.
The figures that matter
- Unemployment rate
- 2.7% July 2026, preliminary, not seasonally adjusted · U.S. Bureau of Labor Statistics The lowest of any market we have researched, below Nashville at 3.0 percent.
- Total nonfarm employment
- 216,200 -0.1% year over year July 2026, preliminary · U.S. Bureau of Labor Statistics Contracting despite the tightest labor market we measure.
- Trade, transportation and utilities
- 54,700 -1.8% year over year July 2026, preliminary · U.S. Bureau of Labor Statistics About 25.3 percent of all jobs, the highest logistics concentration in our coverage.
- Building permits as a share of stock
- 3.1% 2025, Chatham County, our arithmetic on two Census figures · U.S. Census Bureau 4,426 permits against 143,431 units. The heaviest supply response we measure anywhere.
- Construction employment
- 9,400 -4.1% year over year July 2026, preliminary · U.S. Bureau of Labor Statistics The steepest construction decline in the series, alongside the heaviest permitting.
- Manufacturing
- 25,900 +2.4% year over year July 2026, preliminary · U.S. Bureau of Labor Statistics Growing, on the back of an automotive complex located in Bryan County.
- Median household income, Chatham County
- $71,097 ACS 2020-2024, in 2024 dollars · U.S. Census Bureau Among the lowest we have measured, close to Miami-Dade at $71,753.
- Effective cap rate at entry
- Pending Not held · U.S. Census Bureau Transaction cap rates require a licensed subscription we do not hold. We will not estimate one.
Where we would and would not transact
The lowest unemployment we have measured, and employment still fell
Savannah runs a 2.7 percent unemployment rate on a civilian labor force of 221,000. That is the lowest figure in this entire series, below Nashville at 3.0 percent, Huntsville at 3.1 and Raleigh and Atlanta at 3.2. On the conventional reading that is a labor market operating at full capacity.1
Over the same twelve months total nonfarm employment fell 0.1 percent to 216,200. Savannah is the third market in this series to print a negative, alongside Atlanta at minus 0.1 percent and Richmond at minus 0.8.1
Those two facts sit together more comfortably than they first appear, and the resolution matters for an owner. An unemployment rate falls when the number of people looking for work falls, which can happen because they found jobs or because they left the labor force. A metro can therefore post a very tight rate while its job count shrinks, and that is what the Savannah data describes. Employment of 216,200 sits slightly below the labor force of 221,000.1
For a rental thesis the practical reading is that this market has very little slack to absorb new supply through employment growth. A tight labor market supports the rents that exist. It does not, at minus 0.1 percent job growth, generate the additional households needed to fill a wave of new units. That becomes important in the supply section below.12
An unemployment rate falls when fewer people are looking, which can mean they found work or left the labor force. Savannah has the tightest rate we measure and a shrinking job count at the same time.
A quarter of these jobs are the port, and the port is shrinking
Trade, transportation and utilities employs 54,700 people in this metro. Against total nonfarm employment of 216,200 that is about 25.3 percent of all jobs, on our arithmetic the highest concentration of that category in any market we have researched. Miami-Dade runs about 22.0 percent, Atlanta 20.7, Dallas-Fort Worth 20.6 and Charlotte 20.3.1
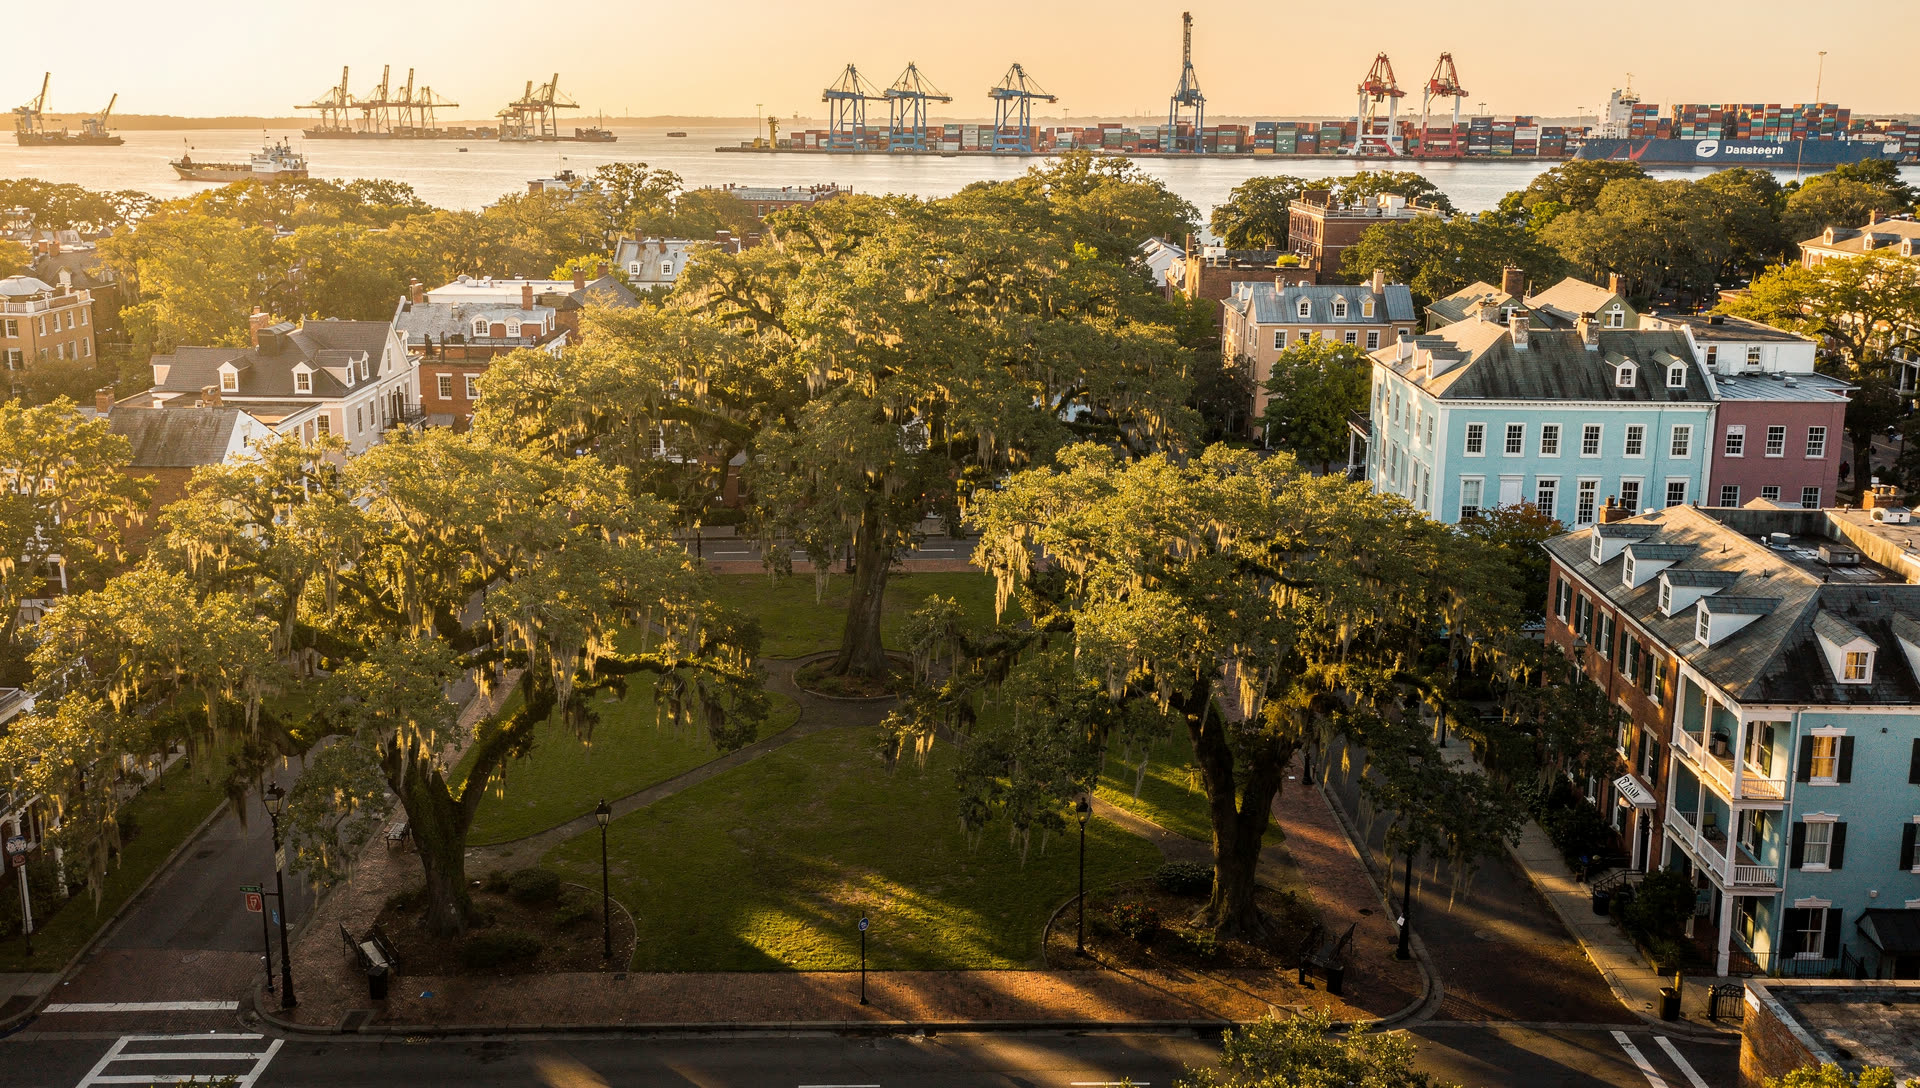
In most metros that category is a mix of retail, wholesale and distribution. In Savannah it is substantially the port and the logistics chain feeding it, which is the defining feature of this regional economy.
That sector fell 1.8 percent over twelve months. So the largest employment block in the most logistics-concentrated economy in our coverage is contracting, and professional and business services, which includes a good deal of the freight, customs and trade services built around it, fell 3.2 percent. Financial activities fell 2.7 percent.1
We would not read a single preliminary month as a structural decline in the port, and container volumes are cyclical in ways that resolve. But an investor should understand what they are buying exposure to. A Savannah rent roll is, to an unusual degree, a claim on global goods movement, and that is a more cyclical and more policy-sensitive base than the healthcare and university payrolls that anchor demand in Raleigh or Huntsville.
The offsetting growth is real but small in absolute terms: education and health services up 2.0 percent on 30,300 jobs, leisure and hospitality up 2.5 percent on 28,900, and manufacturing up 2.4 percent on 25,900.1
- Trade, transportation and utilities: 54,700 jobs, about 25.3 percent of the metro.1
- The highest logistics concentration of any market in our coverage.
- That sector fell 1.8 percent; professional and business services fell 3.2 percent.1
A Savannah rent roll is, to an unusual degree, a claim on global goods movement. That is a different risk from a claim on a hospital system.
The growth engine is in the next county
Sources 3 Office of the Governor of Georgia4 Office of the Governor of Georgia1 U.S. Bureau of Labor Statistics
The most consequential economic development in this region in a generation is not in the county whose housing data this guide reports, and an investor needs to hold both facts at once.
Hyundai Motor Group broke ground on its Metaplant at the Bryan County megasite, with the Governor’s office announcing the project as the largest economic development project in Georgia’s history. The site was selected for its proximity to the Port of Savannah, with rail and highway connections to the terminal. The commitment was reported at $5.54 billion and 8,100 jobs, and with the associated battery joint venture at roughly $7.59 billion and 8,500 jobs across the region over eight years.1
Suppliers have located on both sides of the county line. The Governor’s office separately announced a Hyundai supplier creating over 400 jobs in Chatham County, so some of the effect does land in the county our Census figures describe.1
But the plant itself is in Bryan County. The census figures in this guide are Chatham County: population, tenure, rent, home value and permits. Bryan and Effingham counties are separate jurisdictions inside the same statistical area, with their own assessors, their own millage and their own housing markets.
That produces a specific and avoidable modeling error. An investor shown a Chatham County asset with a business plan citing Metaplant hiring is being shown a demand argument sourced from a different county, one with a shorter commute to the plant and a substantial share of the new construction. The question is not whether the plant creates housing demand. It is which county absorbs it, and over what commute.
It also explains the manufacturing line in the employment table. Manufacturing grew 2.4 percent to 25,900 across the metro, which is consistent with an automotive complex coming online, and it is one of only four sectors growing here.1
The Metaplant is in Bryan County. The housing data in this guide is Chatham County. A business plan that cites the first to justify rents in the second is arguing across a county line.
Permitting near the top of our coverage, against the steepest construction decline
Sources 2 U.S. Census Bureau1 U.S. Bureau of Labor Statistics
Chatham County authorized 4,426 residential building permits in 2025 against a housing stock of 143,431 units. On our arithmetic that is about 3.1 percent of the entire housing stock permitted in a single year, which is the heaviest supply response of any market we have researched. Raleigh-Durham, the previous high, runs about 2.6 percent combined; Huntsville 2.1; Greenville 2.0; Los Angeles 0.6.2
Roughly one new unit permitted for every thirty-two that already exist, in a metro whose total employment fell 0.1 percent, is the single most cautionary combination in this guide. New supply is absorbed by household formation, and household formation follows job growth. Here the first is running at a record rate for our coverage and the second is negative.12
There is a genuine complication in the data that we will not paper over. Construction employment in the metro fell 4.1 percent over the same twelve months, the steepest decline in that sector anywhere in this series. Heavy permitting and a shrinking builder workforce are not obviously consistent.12
Several readings are possible and we cannot distinguish between them from these two series alone. Permits are a leading indicator and may not yet have converted into hiring. Construction employment is reported for the whole metro while permits are reported for one county, so builders may be moving to Bryan and Effingham where much of the new activity sits. Or a small number of large projects may account for a disproportionate share of the permit count. We flag the tension rather than resolving it, and an investor underwriting here should establish which explanation holds in the specific submarket before relying on either number.
What is not ambiguous is the direction of the risk. A market permitting three percent of its stock annually requires conservative lease-up and explicit concession modeling regardless of which explanation is correct.
- 4,426 permits against 143,431 units, about 3.1 percent of stock in one year.2
- The heaviest supply response of any market we have researched.
- Construction employment fell 4.1 percent over the same period, which is in tension with that.1
- Total employment fell 0.1 percent, so household formation is not keeping pace.12
One new unit permitted for every thirty-two that exist, in a metro where employment fell. That is the most cautionary combination in this guide.
Affordability is comfortable, which cuts the usual way
Chatham County median home value is $302,700 against a median household income of $71,097, roughly 4.3 times income on our arithmetic. Median gross rent is $1,471, about 24.8 percent of median household income, and median owner cost with a mortgage is $1,758, a gap of only $287 a month.2
That $287 gap is among the narrowest in our coverage, close to Charlotte at $266 and Greenville at $299. As in those markets, a household with a deposit can cross into ownership without a large monthly step, which caps how hard rent can be pushed.2
Renter share is 43.2 percent, which is a reasonable middle of our range, and population grew 5.6 percent since 2020. Poverty is 13.9 percent, on the higher side of our coverage, and bachelor’s attainment 37.7 percent.2
Georgia preempts local rent regulation entirely, which we set out in the Atlanta guide and do not repeat here. Chatham, Bryan and Effingham counties each set their own millage, so the tax line is a county-specific calculation as it is across every multi-county metro in this series.
What we ask before we buy in Savannah
Sources 2 U.S. Census Bureau1 U.S. Bureau of Labor Statistics3 Office of the Governor of Georgia
We treat Savannah as a watch market. The affordability is reasonable, the labor market is genuinely tight, and the automotive investment is real and large. What holds us back is the arithmetic of the previous sections: permitting near the top of our coverage, behind only Pinal County, Arizona, arriving into a metro whose employment fell, with a quarter of the job base in a contracting logistics sector. Our method is set out in how we evaluate a market, and the full ranked list is on the markets index.
- Which county is the asset in: Chatham, Bryan or Effingham, and which assessor sets the bill?
- If the plan cites Metaplant demand, what is the actual commute from this asset to the site?
- What has been permitted within three miles, and how much of it delivers during the business plan?
- What concession load is modeled during that delivery window, and what do returns look like without it?
- What share of the tenant base draws a port or logistics paycheck?
- What does the model do if container volumes stay soft for another two years?
- What rent growth is assumed against a $287 monthly gap to ownership?2
Ask which county, then ask the commute to the plant. In this metro those two questions decide whether the demand story in the deck applies to the asset in front of you.
Employment by sector
Savannah, GA Metropolitan Statistical Area. Figures are as published for July 2026, preliminary.
| Sector | Jobs | 12-month change |
|---|---|---|
| Trade, transportation and utilities | 54,700 | -1.8% |
| Education and health services | 30,300 | +2.0% |
| Leisure and hospitality | 28,900 | +2.5% |
| Manufacturing | 25,900 | +2.4% |
| Government | 25,500 | +0.4% |
| Professional and business services | 24,000 | -3.2% |
| Mining, logging and construction | 9,400 | -4.1% |
| Other services | 8,600 | 0.0% |
| Financial activities | 7,300 | -2.7% |
| Information | 1,600 | +6.7% |
Source: U.S. Bureau of Labor Statistics, Economy at a Glance, Savannah, GA. Retrieved September 2, 2026.
The demand base
Population, tenure, incomes and housing costs for the county. These are the figures that decide whether a renter household exists, and whether it could buy instead.
| Measure | Value | As of |
|---|---|---|
| Population, Chatham County | 311,855 +5.6% since April 2020 | July 1, 2025 estimate |
| Households | 120,383 | ACS 2020-2024 |
| Housing units | 143,431 | July 1, 2025 |
| Owner-occupied rate The remaining 43.2 percent rent. | 56.8% | ACS 2020-2024 |
| Median gross rent About 24.8 percent of median household income. | $1,471 | ACS 2020-2024 |
| Monthly owner cost with a mortgage Only $287 above the median rent. | $1,758 | ACS 2020-2024 |
| Median household income | $71,097 | ACS 2020-2024, in 2024 dollars |
| Median home value About 4.3 times median household income. | $302,700 | ACS 2020-2024 |
| Building permits 2025 | 4,426 | 2025, Chatham County, all residential |
| Poverty rate | 13.9% | ACS 2020-2024 |
| Bachelor’s degree or higher | 37.7% | ACS 2020-2024, age 25+ |
| Mean travel time to work | 23.0 min | ACS 2020-2024 |
Source: U.S. Census Bureau, QuickFacts, Chatham County, Georgia. Retrieved September 2, 2026.
